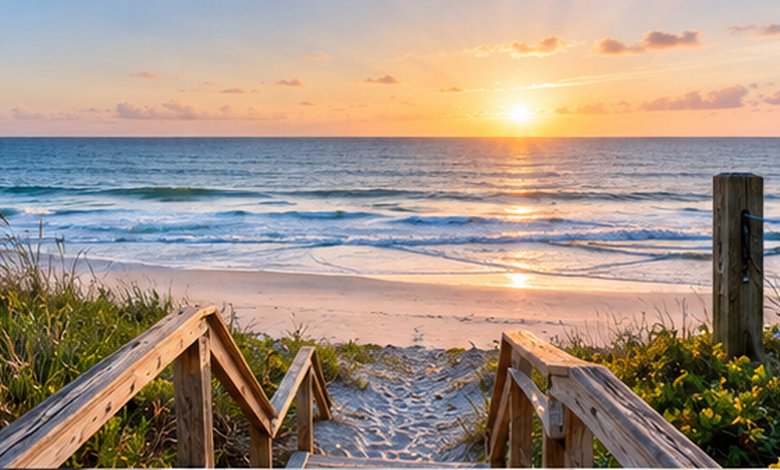
Hampton NH tide chart details, timing tips, beach safety, fishing, boating, and how weather can change actual tides.
The Hampton NH tide chart is based on NOAA’s Hampton Harbor station, 8429489. Hampton typically experiences two high tides and two low tides each day, but actual water levels can differ from predictions because wind, atmospheric pressure, storms, and other conditions can raise or lower the water.
If you are heading to Hampton Beach, the tide can quietly change the entire experience. A wide stretch of sand at low tide can become much narrower a few hours later, while conditions around Hampton Harbor can matter even more if you are boating or fishing.
The useful part of a Hampton NH tide chart is not simply knowing whether the next tide is high or low. The real trick is understanding when the water changes, what the predicted height actually means, and when you should stop trusting the chart alone.
What You'll Discover:
Hampton NH tide chart: what the numbers mean
NOAA’s official reference for Hampton Harbor is station 8429489, a subordinate tide station referenced to Portland, Maine. NOAA lists a 14-minute high-tide time offset and a 32-minute low-tide offset for the Hampton Harbor station, along with a height adjustment.
That matters because a tide chart is not a generic forecast for the entire New Hampshire coastline. It is a prediction tied to a particular location and tidal datum.
NOAA station 8429489 is the official Hampton Harbor tide-prediction station used for Hampton-area tidal information.
Most Hampton tide heights are reported relative to Mean Lower Low Water (MLLW). In plain English, a height such as 9 feet does not mean the ocean is exactly 9 feet deep at the beach; it describes the predicted water level relative to a standardized reference surface.
This distinction becomes particularly important for boaters, engineers, property owners, and anyone comparing tide information from different websites.
How often does Hampton Beach get high and low tides?
Hampton has a semi-diurnal tidal pattern, meaning there are normally about two high tides and two low tides during a tidal day. The two highs and two lows are not necessarily the same height.
Think of the tide as a slow oceanic pendulum rather than a simple twice-daily switch. The water rises, reaches high tide, falls toward low tide, rises again, and repeats, with the timing shifting from one day to the next.
The Hampton-Seabrook Estuary Management Plan reports that the estuary exchanges a substantial portion of its water volume during each tide and that tidal heights vary with spring, neap, and perigean tidal cycles.
That is why simply memorizing “high tide is around noon” is not useful. Tomorrow’s high tide may occur considerably earlier or later.
Hampton tide example for October 3, 2026
For Saturday, October 3, 2026, the Hampton Harbor prediction is approximately:
| Tide | Time | Predicted height |
| High tide | 4:54 a.m. | 7.9 ft |
| Low tide | 11:07 a.m. | 1.0 ft |
| High tide | 5:09 p.m. | 9.0 ft |
These values are from the Hampton Harbor tide series associated with NOAA station 8429489 and are useful as a real-world example of how the daily cycle works.
Notice something interesting: the evening high tide is considerably higher than the morning high tide. That difference is normal. Tides are governed by several interacting astronomical cycles, so the two daily high waters do not have to match.
For an actual trip, always check the latest day’s prediction rather than relying on a static example. NOAA’s tide-prediction service can generate current and future predictions, while NOAA’s operational forecasts provide additional information when weather-driven water-level changes matter.
Why the Hampton tide chart is useful for beachgoers
For a typical beach visitor, the tide chart answers a deceptively simple question: How much beach am I likely to have?
At low tide, more of the intertidal beach is exposed. As the tide rises, water moves landward and the usable dry-sand area shrinks.
That makes tide timing especially useful for activities such as:
- Beach walks
- Photography
- Beachcombing
- Exploring exposed shoreline
- Planning a long family beach visit
- Choosing when to arrive and leave
- Checking whether an access route may become wet
New Hampshire State Parks notes that the ocean shoreline is a dynamic environment that is inundated by tides twice daily. It also specifically warns that the platform at Hampton Beach State Park’s 18th Street access can be inundated during high tide.
So if your goal is maximum exposed sand, a falling or low tide may be attractive. If your priority is swimming, however, tide height should never be treated as a stand-alone safety forecast.
High tide vs. low tide at Hampton Beach
| Situation | High tide | Low tide |
| Exposed beach | Less | More |
| Shoreline walking | Less room | More room |
| Beachcombing | Generally less exposed area | Generally more exposed area |
| Water reaches farther up beach | Yes | No |
| Some access areas | May be inundated | More likely accessible |
| Swimming conditions | Not automatically safer | Not automatically safer |
| Flooding concern | Greater when weather adds surge | Usually lower, but conditions vary |
The important phrase in that table is “not automatically safer.”
A low tide can expose more sand without making the ocean safe for swimming. Rip currents, waves, wind, surf conditions, and lifeguard warnings can matter much more than the tide phase itself.
New Hampshire State Parks advises swimmers to pay attention to the beach flag system and lifeguard guidance. A yellow flag indicates medium hazard, while a red flag indicates high hazard and restricted swimming.
Why the predicted tide can be wrong
This is one of the biggest misunderstandings about tide charts.
A tide prediction is primarily a prediction of the astronomical tide, the regular water-level movement associated with the gravitational effects of the Moon and Sun and Earth’s rotation. It is not a guarantee of the water level you will see on the beach.
A tide chart predicts the astronomical tide; weather can push the actual water level higher or lower.
Strong onshore winds can push water toward shore. Atmospheric pressure changes can also affect water levels, while storms can produce surge that substantially changes coastal conditions.
This is why a predicted 9-foot high tide should not be interpreted as a precise promise that the water will reach exactly that level.
NOAA explicitly distinguishes predicted water levels from observed conditions and notes that wind, atmospheric pressure, storm surge, and other weather effects can produce differences.
When tides become a flooding concern
For Hampton residents and visitors, the most important tide is sometimes not the biggest astronomical tide on the chart. It is the high tide that arrives while a storm is pushing additional water toward shore.
Hampton experienced this in September 2026, when a coastal storm brought strong northeast winds, large waves, and elevated water levels over multiple high-tide cycles. The Town of Hampton warned that low-lying roads, parking lots, properties near the harbor and marsh could experience flooding and that beachfront splash-over could occur even when water levels remained below formal flood stage.
The National Weather Service’s Hampton Harbor guidance identifies 11.0 feet MLLW as the minor coastal-flood threshold, 12.0 feet for moderate flooding, and 13.0 feet for major flooding at the station.
Those thresholds are not beach-safety guarantees. They are flood-impact categories for the coastal area, and local impacts can vary depending on waves, wind direction, location, and the shape of the shoreline.
A normal high tide and a storm-driven high water event are not the same thing. Weather can add water on top of the astronomical tide.
Using the tide chart for fishing
Tide timing can be particularly useful for anglers because moving water can change how bait, prey, and fish behave around inlets and channels.
But there is no universal rule that says “high tide equals best fishing.” Species, season, water temperature, wind, bait movement, structure, and the exact location can all change the result.
For Hampton Harbor, an angler might use the tide chart to identify periods surrounding a tide change, then combine that information with weather and local fishing conditions.
The key is to treat the tide as one part of the fishing plan, not the entire plan.
For surf fishing, the situation can be different from fishing inside Hampton Harbor. Ocean waves, wind direction, beach structure, and surf conditions can dominate what is happening along the open shoreline.
Using the tide chart for boating
Boaters have a different reason to care about tides.
A rising tide can increase available water depth in some areas, while a falling tide can reduce clearance over shallow ground. In a narrow harbor or channel, the timing of the tide can therefore affect route planning.
Hampton Harbor is connected to the Atlantic through Hampton Beach and includes channels, marshes, and harbor infrastructure. Local navigation conditions can be affected by shoaling and currents as well as water level, so a tide table should not be treated as a substitute for current nautical information.
For boating, the better question is not simply “What time is high tide?” It is “What will the water level and current be along my intended route when I get there?”
That distinction can prevent a surprisingly expensive mistake.
How to read a Hampton tide chart correctly
Start with the date. Tide times move from day to day, so yesterday’s schedule is rarely useful for tomorrow’s outing.
Next, identify the high and low tides and their predicted heights. If you are planning a beach walk, the timing may matter more than the exact height; if you are concerned about flooding or navigation, both timing and height become more important.
Then check the weather.
If a strong coastal storm, persistent onshore wind, or coastal flood advisory is in effect, move beyond the basic tide chart and check NOAA and National Weather Service information. NOAA’s Operational Forecast Systems are specifically designed to incorporate real-time observations and meteorological conditions into short-term water-level forecasts.
Finally, check local beach conditions before entering the water.
New Hampshire State Parks maintains information on tides, flags, beach conditions, and rip currents for Hampton Beach.
Common Hampton tide-chart mistakes
Assuming high tide means the water is dangerous
High tide simply describes a stage of the tidal cycle. It does not automatically mean dangerous swimming conditions.
Wave height, rip currents, wind, storms, and lifeguard warnings can matter more for swimmers.
Treating the tide height as water depth
A prediction of 9 feet does not mean there will be 9 feet of water where you are standing.
Tide height is measured against a reference datum, and local beach elevation and underwater topography determine the actual depth at a particular spot.
Using the tide chart without checking weather
This is perhaps the most consequential mistake.
A calm-weather tide prediction can look perfectly ordinary while a storm produces elevated water, waves, erosion, or flooding around the same high tide. Hampton’s 2026 coastal-flood alerts demonstrate why astronomical tide predictions and weather forecasts need to be considered together.
Assuming every Hampton-area location has identical tide times
Hampton Beach, Hampton Harbor, marsh areas, inlets, and nearby coastal locations do not necessarily experience precisely the same conditions.
NOAA’s own tide-prediction guidance emphasizes that predictions are tied to specific stations where tidal data has been collected and analyzed.
Best time to visit Hampton Beach based on the tide
There is no single “best” tide for everyone.
For beachcombing or seeing more exposed shoreline, many visitors will prefer the hours around low tide.
For swimming, prioritize lifeguard coverage, beach flags, rip-current information, surf, and weather rather than choosing a time solely because the tide is high or low.
For photography, the choice depends on what you want in the frame. Low tide can reveal more texture and shoreline; a higher tide can create a more expansive ocean foreground.
For fishing, compare tide movement with the species, location, season, wind, and local reports.
For boating, use tide predictions alongside navigation charts, current information, weather, and vessel-specific clearance requirements.
That is the more useful way to think about Hampton’s tides: match the tide phase to the activity instead of looking for one universally perfect tide.
Hampton tide chart planning checklist
Before heading out, check:
- The exact date and local tide times
- High- and low-tide heights
- Wind direction and speed
- Wave and surf conditions
- Rip-current warnings
- Coastal flood advisories
- Lifeguard availability
- Your specific shoreline or harbor location
- Whether the activity depends on exposed or covered beach
- Whether current conditions differ significantly from the predicted tide
This takes only a few minutes and gives you a much more realistic picture than a tide table by itself.
Frequently Asked Questions
What is the NOAA station for Hampton, NH tides?
Hampton Harbor’s NOAA tide station is 8429489. NOAA identifies it as a subordinate station referenced to Portland, Maine.
How many high tides occur at Hampton Beach each day?
Hampton normally has about two high tides and two low tides per day because the area follows a semi-diurnal tidal pattern. The two highs and two lows can have different heights.
Does high tide mean Hampton Beach will be underwater?
No. High tide means the tidal water level is at its daily high point. How far water reaches up the beach depends on local elevation, waves, weather, and other conditions.
Can storms make Hampton’s tide higher than predicted?
Yes. Wind, atmospheric pressure, storm surge, and other weather-related effects can cause observed water levels to differ from astronomical tide predictions.
Is low tide safer for swimming?
Not necessarily. Tide height alone does not determine swimming safety. Check rip-current information, surf conditions, beach flags, lifeguard advice, and weather before entering the water.
Key Takeaways
- The Hampton NH tide chart is tied to NOAA Hampton Harbor station 8429489.
- Hampton normally experiences about two high tides and two low tides each day.
- Tide heights are predictions relative to MLLW, not measurements of water depth at your feet.
- Actual water levels can differ from predictions because of wind, atmospheric pressure, storms, and surge.
- Low tide generally exposes more beach, while high tide pushes water farther landward.
- Swimming safety depends on much more than tide timing; check flags, rip currents, surf, weather, and lifeguard guidance.
- During coastal storms, always check the latest National Weather Service and NOAA water-level information, not just the tide table.
Additional Resources
- NOAA Tide Predictions: The official source for Hampton Harbor tide predictions, including high/low times, heights, dates, and station information.